Google Season of Docs with MDAnalysis
In GSOD,I’m excited to be working with MDAnalysis to construct a user guide in the first ever Google Season of Docs!
MDAnalysis is a Python library for molecular dynamics simulations analysis. Like many other MD libraries, it can be applied to the majority of molecular dynamics formats. It has a few distinguishing features:
- the sheer range of analysis available, as the library is constantly updated with new methods
- the ability to easily build custom analyses using the analysis and topology building blocks of the library
- the developers are actively implementing parallel analysis features in a separate module called pmda. As this is still in alpha, it is not in the scope of this project — but I look forward to it!
The library is so complex that the current documentation, which is structured around the code, is very difficult to navigate. Moreover, MDAnalysis is used by an array of scientists with varying interest in the inner workings of the code. From now until February, I will work with @orbeckst and @richardjgowers to build a user guide that caters to both developers and users more focused on application.
Project description
A guide to the MDAnalysis library, separate from the API reference, that includes:
-
A detailed guide to the data structures used in MDAnalysis. This page will introduce the Atom, AtomGroup, and Universe classes; include I/O options; and contain information on manipulating Atoms and combining AtomGroups.
-
A page on the Analysis building blocks. The AnalysisBase class, AnalysisFromFunction class, and analysis_class functions form the basis of any user-defined analysis. What each class does under the hood is worthwhile knowing, e.g. if it’s analogous to numpy.vectorize.
-
A page on selecting groups of atoms using Universe.select_atoms. Both the technical details and the molecular dynamics knowledge behind the way that this is implemented.
-
A page on topologies. Users should understand the data structure, usage, manipulation and framework for building systems.
-
A page on available visualization methods, both for the trajectory and for current analyses that return data for visualization.
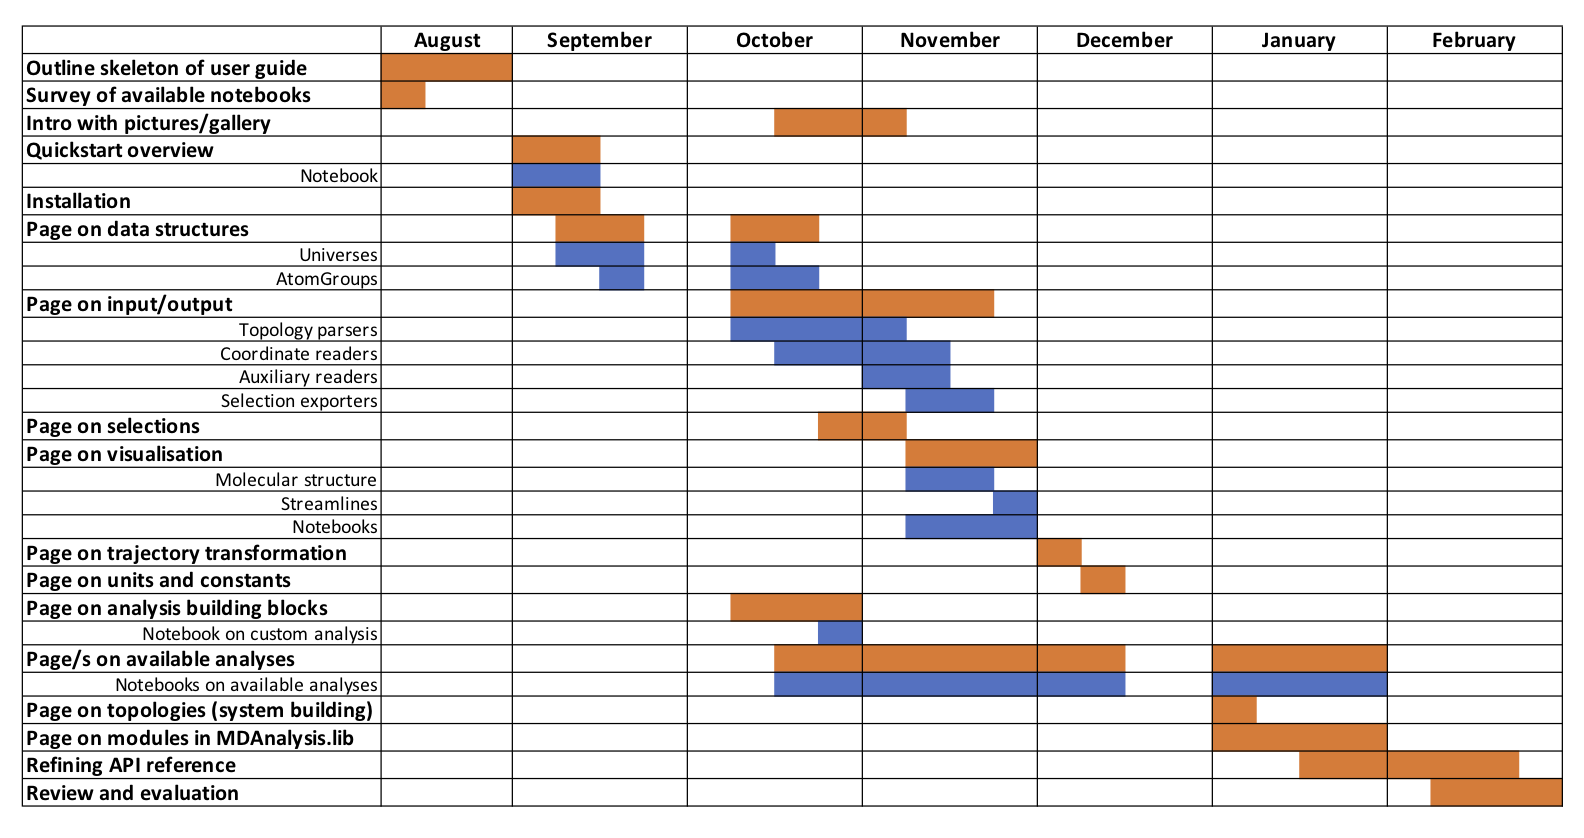
Timeline
August 7th (UTC) kicks off a period of “community bonding”. During this time, Oliver, Richard, and I will sketch out the user guide and refine expectations. From September the actual development starts! I hope to keep to this timeline.
I will be documenting my progress on this blog under the category GSOD.